Ching1.pdf
2584K download, 5 printed pages
Pages 1.02-11.06 from
Building Construction Illustrated, Fourth Edition, Francis D. K.
Ching

TH146 .C52 2008
| PerlEnergyBasics 2009 Spring Semester Associate Professor Robert D. Perl, AIA |
| Texas Tech University College of Architecture Robert D. Perl | updated 02/13/2009 |
| This page
is 900 pixels wide for on-screen presentation. It won't print correctly
without resizing the images. Source articles are downloadable in pdf format. Right-click pdf links and select "Save Target As" to save locally. Printing from a local copy sometimes works better. I recommend the Foxit pdf Reader. It's free like Adobe Reader, but opens files much quicker and seems to be more stable. Foxit pdf Reader download Adobe Reader download |
| Background 1973 Oil Crisis 1979-80 Energy Crisis Passive Cooling Earth Temperature Earth Cooling Tubes Various projects and classes: 1980s Sustainable Design Workshop: 2006 Fall, 2007 Fall Next semester?: Sustainable Design Topical Studio |
A Golden Thread: 2500 Years of Solar Architecture and Technology TJ810 .B88 History of Solar (pdf) History of passive solar building design |
|
Ching1.pdf |
TH146 .C52 2008 |
| Architecure 2030 Challenge |
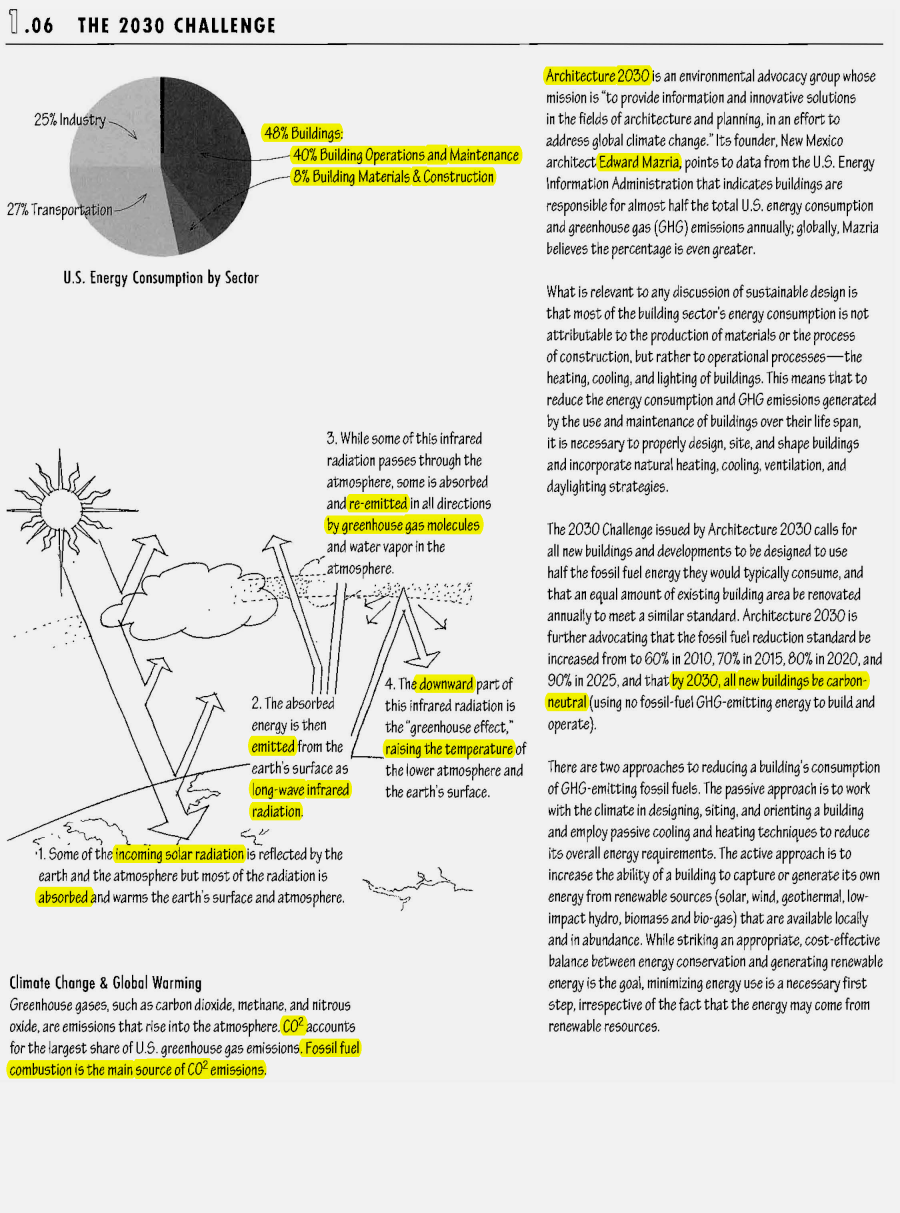 Ching1 page 5 |
|
Design Process http://media.wiley.com/product_data/ excerpt/37/04716961/0471696137.pdf 568K download, 34 printed pages Pages 1-34 from The HOK Guidebook to Sustainable Design, 2nd Edition "TEN KEY STEPS The following ten steps are the key process steps that form the organizational framework of this book. We recommend that these be used to guide an integrated team approach to sustainable design. Step One: Project Definition Owner, client representatives, and design team leaders should establish and clearly embed sustainable design tasks in the scope of work, document these in the contract agreement, and coordinate these with the project schedule. Step Two: Team Building Seek design team members who are experienced and committed to sustainable design and working collaboratively. Assemble the full design team and identify sustainable champions for the owner and the design team. Step Three: Education and Goal Setting Engage team in discussion of sustainable issues and opportunities, including cost and schedule impacts. Then hold a sustainable goal session with all team members to set broad goals and measurable outcomes, such as a LEED target. Review design criteria and standards and challenge those that work against integrated sustainable solutions. Step Four: Site Evaluation Analyze the site to identify constraints and sustainable opportunities. Evaluate the microclimate and macroclimate to determine solar and wind availability and orientation, potential thermal sinks, and rainfall. Inventory plant and animal species and their habitats. Identify transportation networks, and cultural and/or historical resources that should be preserved. Step Five: Baseline Analysis Develop baseline energy and water analysis; establish budgets and compare with benchmarks and project sustainable design goals. Explore potential for renewable energy, financial incentives, and/or utility rebates for energy efficiency, water, and renewables. Step Six: Design Concept Use an integrated and collaborative design process to embed sustainable strategies within a design concept that is responsive to the project site and the regional ecosystem. Step Seven: Design Optimization Explore, test, and evaluate a broad range of solutions to discern those with greatest potential. Engage the entire design team in a multidisciplinary approach to seek synergies in the development and refinement of building and site systems. Step Eight: Documents and Specifications Carefully document all project requirements. Engage in a process to update and improve contract documents and specifications to ensure that sustainable goals, including materials, systems, and other requirements, are being incorporated. Step Nine: Bidding and Construction Engage design team, contractor, and owner in a collaborative approach to bidding, buyout, procurement, construction, and commissioning to deliver a healthy, environmentally responsible facility that meets project sustainable design goals. Step Ten: Postoccupancy Engage design team and building users in discussion to discover ways to improve building operations, maintenance, and occupant satisfaction. Undertake a postoccupancy evaluation to evaluate hard and soft metrics and to identify lessons learned." |
 NA2542.36 .M46 2006 |
|
 |
| "LIFE
SAFETY ANALOGY Until the nineteenth century, we generally built buildings, communities, and cities without the help of building codes, life safety codes, zoning regulations, or any of the myriad of other restrictions that guide us today. As the industrial revolution spread in Europe and North America, the nature of buildings began to change, the use of buildings began to change, and the kinds of buildings necessary to accommodate new industrial processes began to change as well. These changes quickly led to a series of building disasters of an unprecedented order—fires, structural failures, decayed neighborhoods, and pollution of all kinds. Much of the history of building in the nineteenth century is one of trial and error as people struggled to understand these problems and arrive at solutions. It took about a hundred years to arrive at a generally accepted set of rules to deal with basic issues of safety and fire protection in modern buildings. Those rules are the basis for today’s collection of building and safety codes. Today, we follow the much-improved version of those rules, but we do so in an almost automatic way. It is second nature to us because society agrees on the necessity for safe buildings and communities. Designers, builders, owners, and operators know instinctively the “right” way to approach things. There is no debate about the goals of having safe buildings; rather, there is a constant upward cycle of improvement in the safety performance of our buildings. We now must move forward by focusing on environmental and health issues, on moving toward sustainable design in the twenty-first century, just as our nineteenth-century predecessors focused on life safety. We are only now beginning to see the challenges we face as we attempt to create buildings and communities that will sustain us. We are just beginning to understand cause and effect as well as the urgency of the environmental and health challenges that confront us. And we are just starting to look for the solutions. Like our predecessors did with life safety issues, we need to be self-conscious, careful, and deliberate about this effort. Unlike them, we don’t have a hundred years to figure this out." |
|
Ching3.pdf |
| p 11.03
"At rest, the human body produces about 400Btu/h (117W). ...strenuous activities can cause the body to generate up to 1200Btu/h (351W)." |
"Armstrong can ride up the mountains in
France generating about 500 watts of power for 20 minutes, something a
typical 25-year-old could do for only 30 seconds."
How Lance Armstrong Gets His Unusual Energy NYT 500W = 1,706Btu/h = 0.67horsepower onlineconversion.com |
|
Means of heat transfer: Conduction Convection Radiation Evaporation |
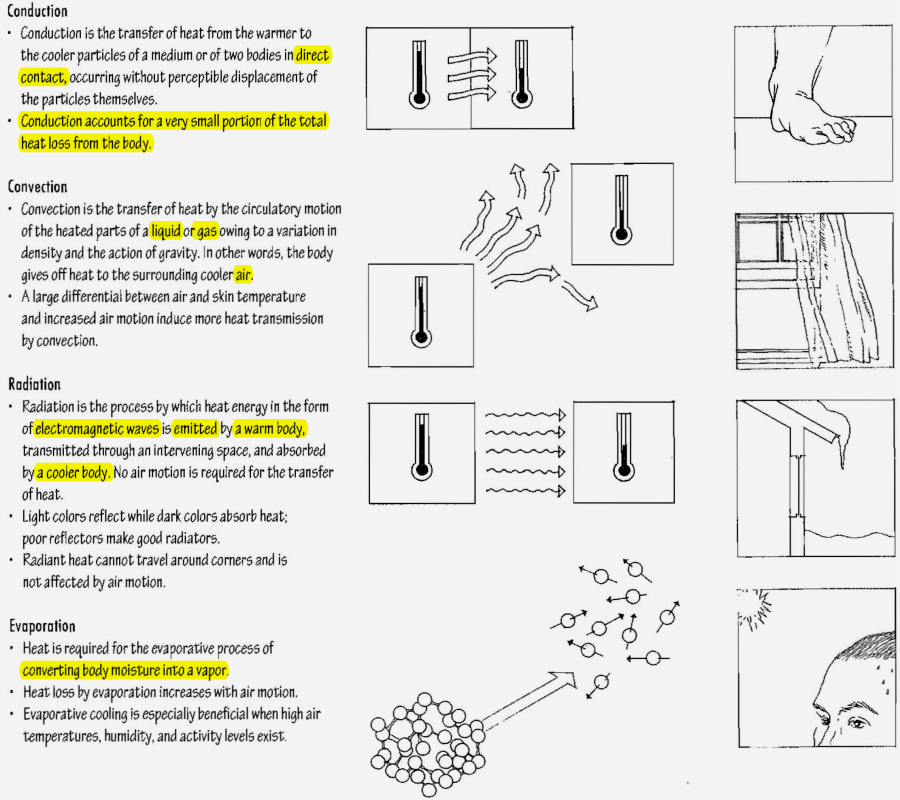 Ching3 page1 |
 Ching3 page2 |
| water
boiling point: 212F° = 100C° water freezing point: 32F° = 0C° degree size: 1F° x = 0.55C° 1C° x 1.8 = 1.8F° temperature conversion: (F° - 32) x 5/9 = C° (C° x 1.8) + 32 = F° example: (68F° - 32) x 5/9 = 20C° example: (-40C° x 1.8) + 32 = -40F° |
|
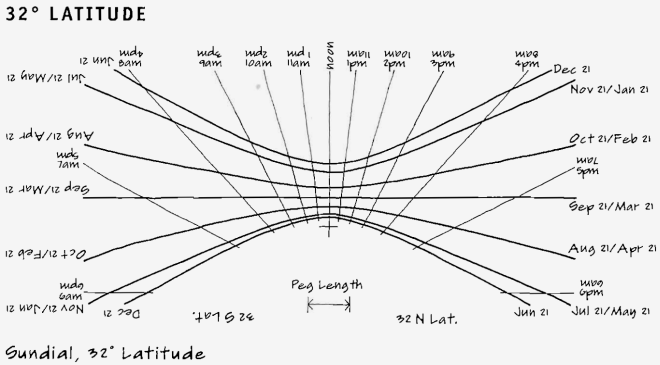
Mazria.pdf |
 TJ810 .M32 1979 |
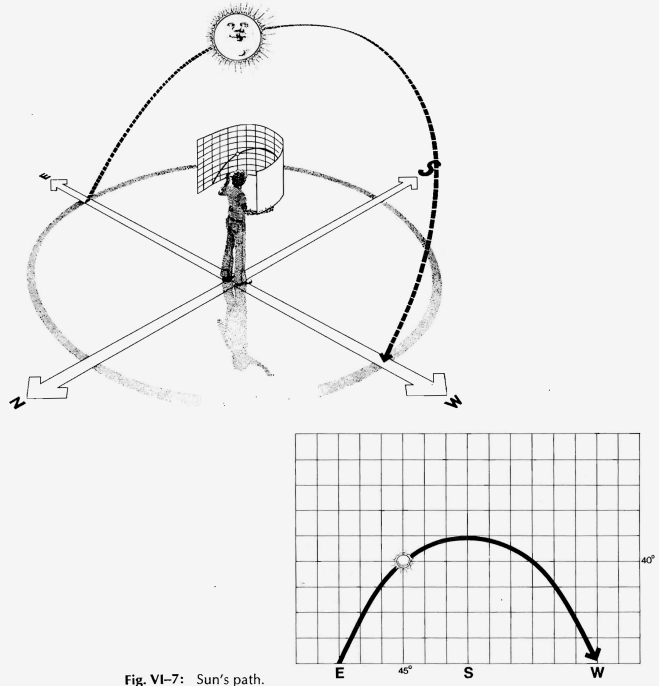
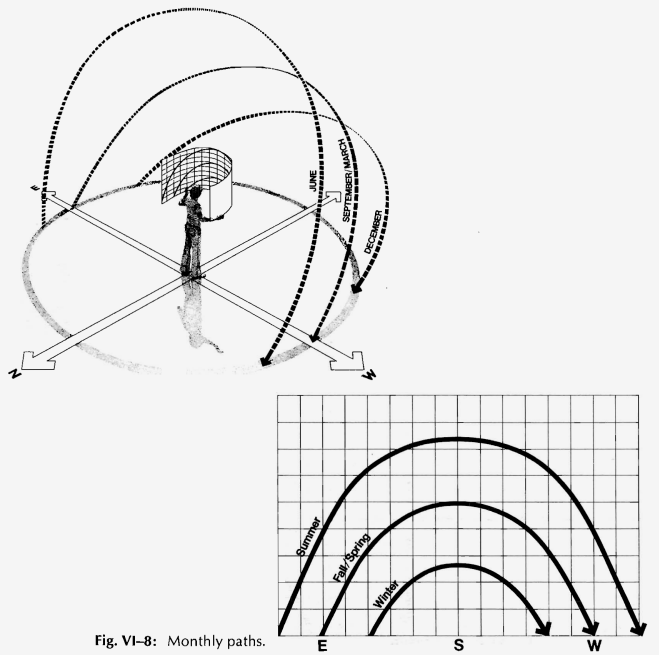
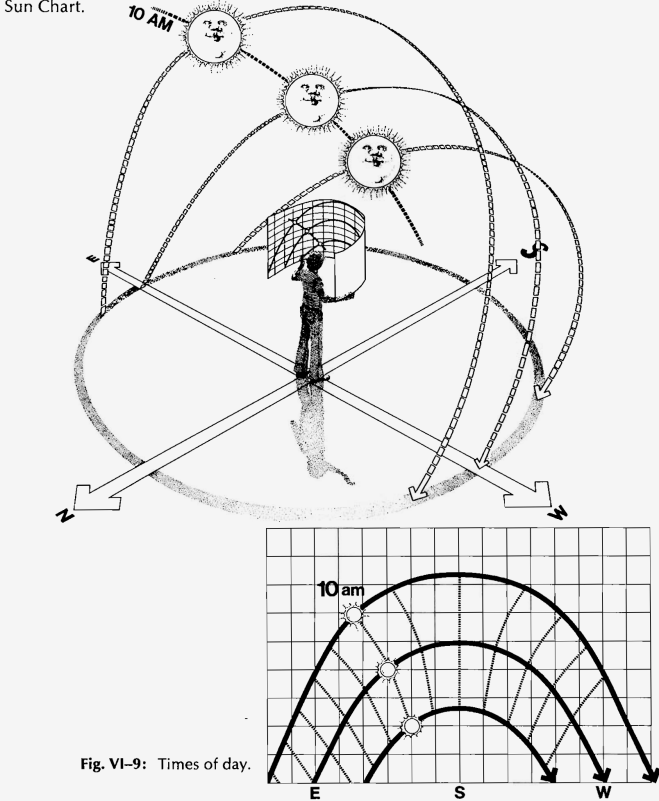
 Mazria page 4 |
 |
 |
 |
 |
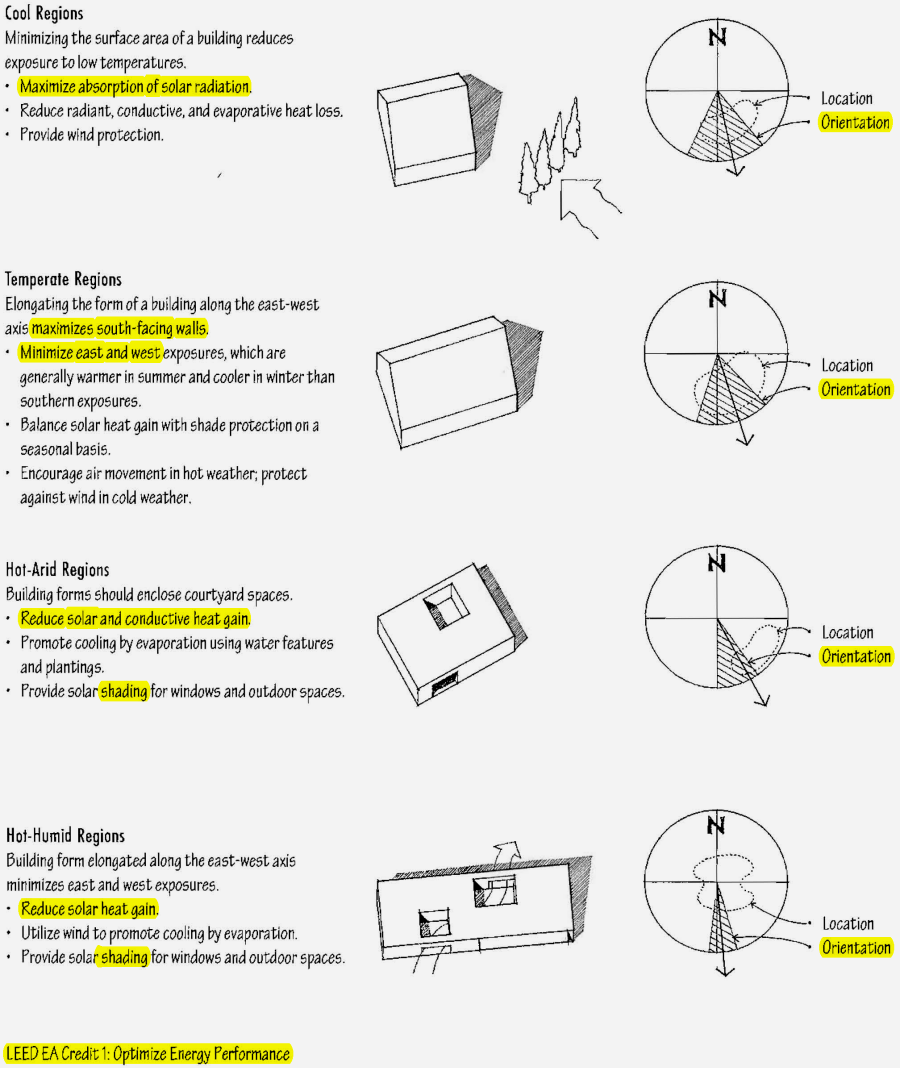
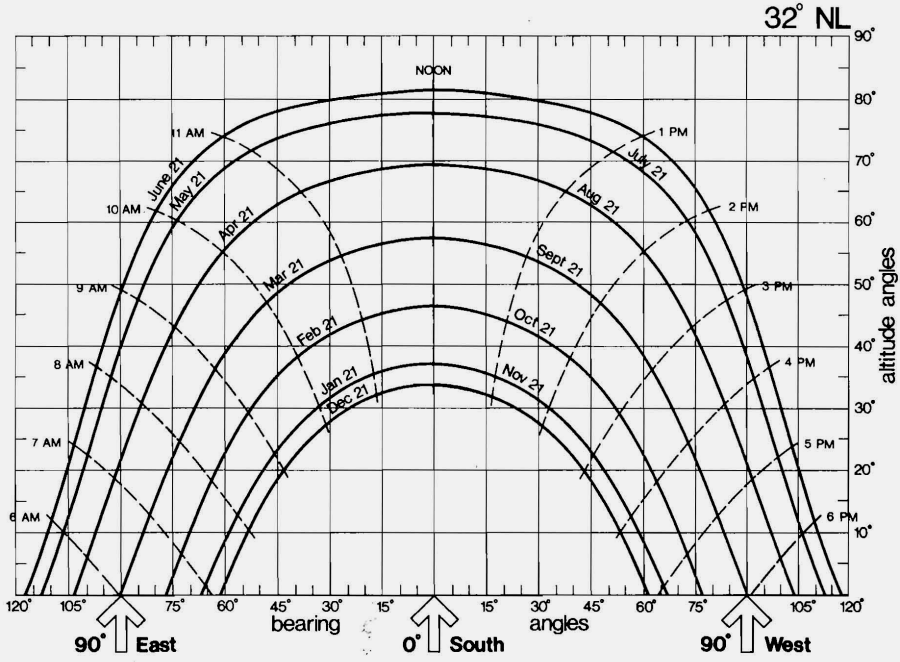 Mazria page 8 |
|
Brown.pdf 266K download, 3 printed pages PRINT PAGE 2. RECOMMENDED: Select "Auto-Rotate" in the Print dialog. Pages 305, 54-55 from Sun, Wind & Light, 2nd Edition, G. Z. Brown and Mark DeKay |
 NA2542.3 .B76 2001 |
 Brown page 1 |
|
Ching4.pdf |
 Ching4 page 2 |
 Ching4 page 4 |
 Ching4 page 6 |
 Ching4 page 7 |
|
Ching2.pdf |
 Ching2 page 1 |
 Ching2 page 2 |
 Ching2 page 3 |
|
LCD Lubbock
2007.pdf |
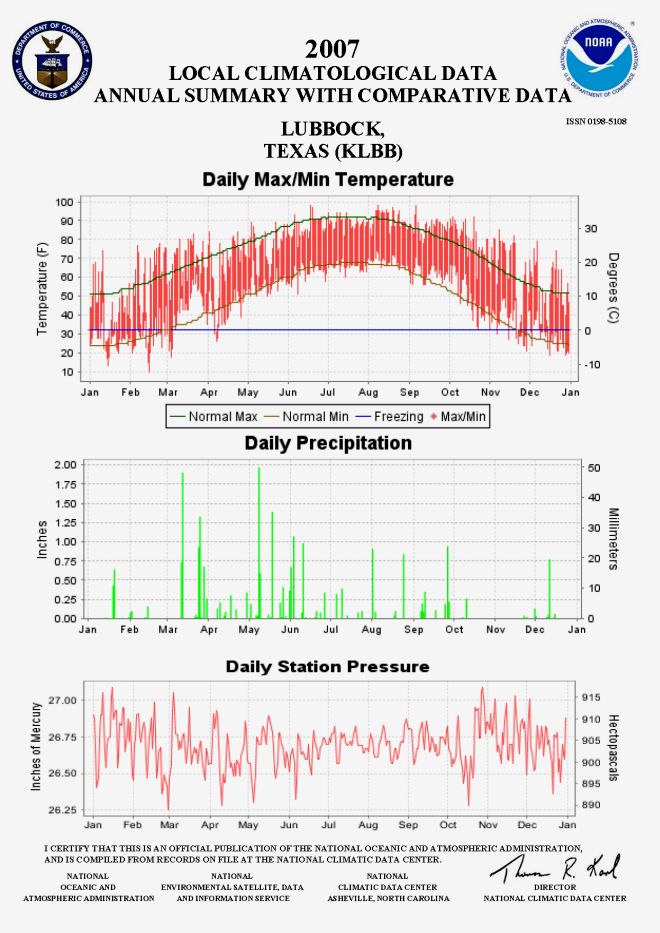 LCD Lubbock2007 page 1 |
Local Climatological Data (LCD) at NOAA National Climate Data Center Data available from 27 stations in Texas. Access is free from TTU.edu domain. |
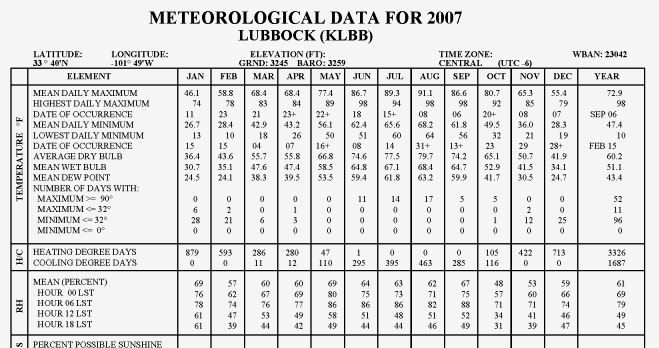 LCD Lubbock2007 page 2 |
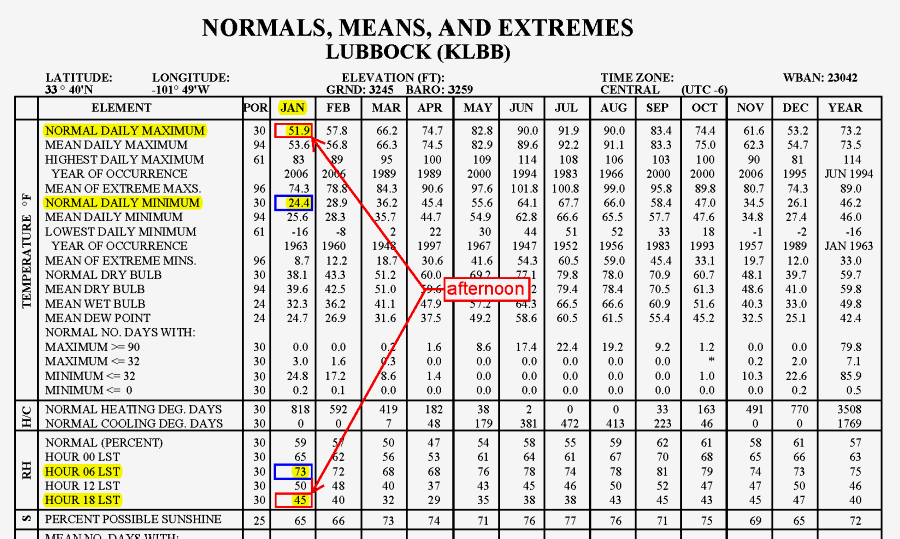
DO NOT confuse Meteorological Data for a single year (usually page 2) with Normals, Means, and Extremes (usually page 3) . Reference Notes (usually page 6) and the written description of local geography and climate (usually page 7) are worthwhile reading. |
 |
| LCD Lubbock2007
page 3 |
 Brown page 2 |
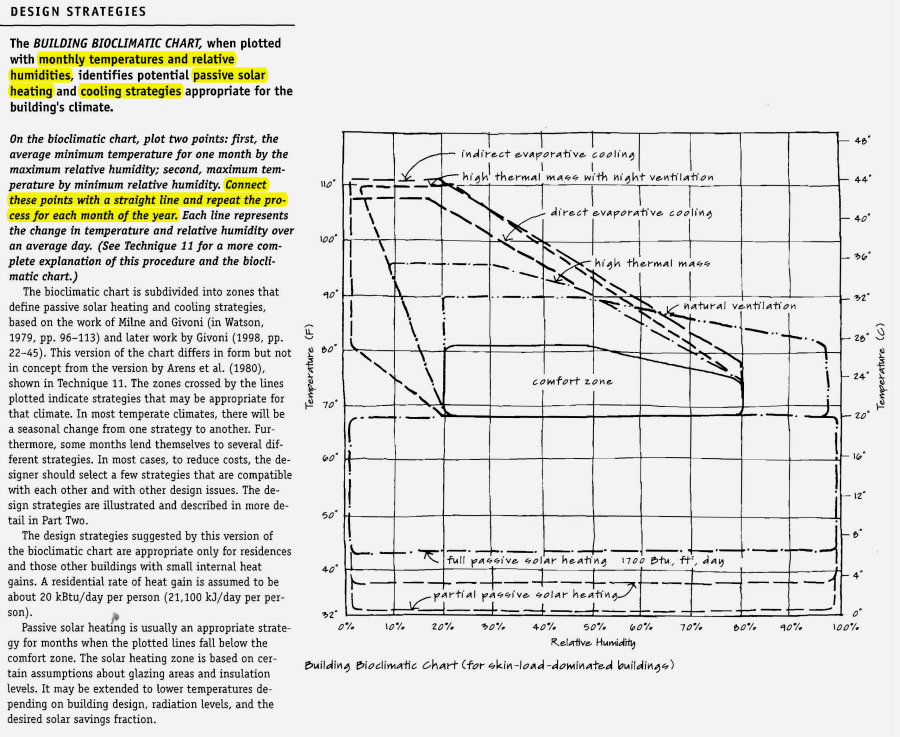
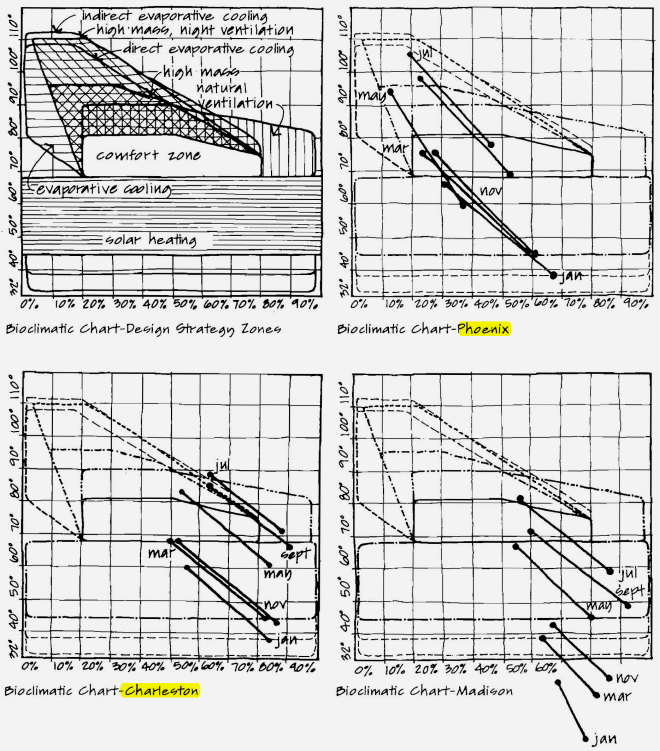
| Step 1 Plot January afternoon. Temperature- Normal Daily Maximum: 51.9°F Relative Humidity- Hour 18 LST (6pm): 45% Step 2 Plot January morning. Temperature- Normal Daily Minimum: 24.4°F Relative Humidity- Hour 06 LST (6am): 73% Step 3 Draw a straight line connecting these two points. Step 4 Label "Jan". Repeat for the other months. |
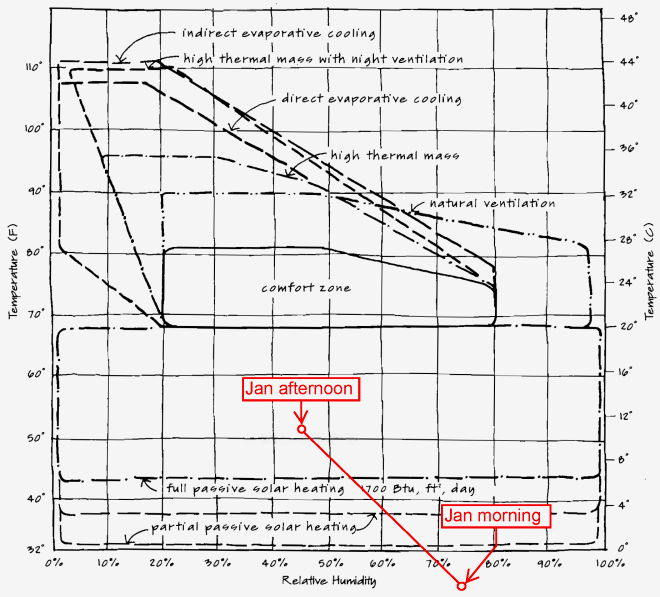 |
 Lubbock Normals plotted |
 Brown page 3 |
| Texas Tech University College of Architecture Robert D. Perl | copyright © 2009 |
| "All materials on this website are for the exclusive use of students enrolled in the College of Architecture during 2009 Spring Semester and are protected by copyright of their respective authors." |
| Associate Professor Robert D. Perl, AIA AH 1002D Office Hours: TTh 1:30-3:00 pm or by appointment (806) 742-3169 x248 robert.perl@ttu.edu |